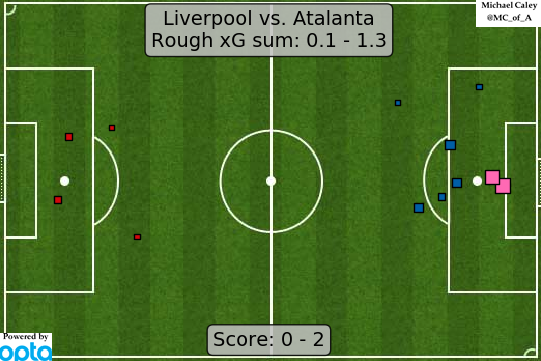
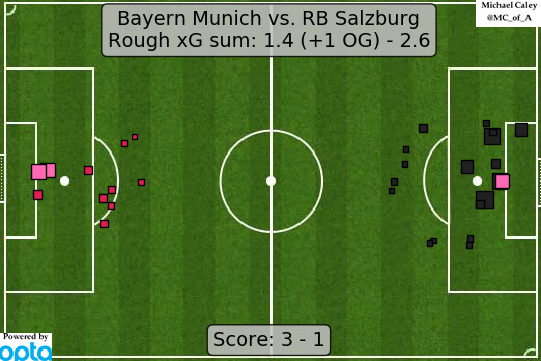
But nevertheless of it being included, it is still mentioned in that stat because even xG agrees that it matters.
The whole point of the statistic is to showcase who had better attempts at goal, so you would obviously add the own goal to the hypthesis you make from that stat. Even if it's not added with a value.
It also says "2.6 goals expected" yet you say
I mean, doesn't 2.6 xG literally say either 2 or 3 goals were expected? That's roughly the same amount Bayern actually had, with the offside goal still included..
Statistically this just says it was a somewhat equal game, and that would match the impression I got from watching it.
Honestly I think xG is shit anyway. There's tons of flaws about how it rates the quality of the chances already, but one of them is also how it just assumes everyone is equal in their ability which realistically is of course is just never the case. There are goalkeepers that save better than other goalkeepers, there are strikers that score more reliably than other strikers. And the xG value of Valon Berisha standing in front of Manuel Neuer can obviously not be the same as the value of Robert Lewandowski standing in front of Cican Stankovic.
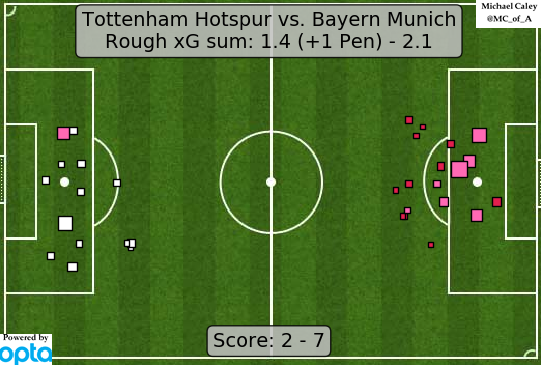
I mean this is the type of shit xG gets you at times. Spurs matching Bayerns xG when you include the penalty (75% of pens are scored; Harry Kane scores even 85%).
It's sometimes helpful, sometimes just outright weird.
Don't agree, apart from one of your points that I underlined.
1) Point of xG models is to showcase how good were the chances created by each team.
If by own goal you mean the attempt that was mistakenly taken by the player of the opposition and ended up at the back of his own net, I don't see how it shows anything about the chances a team can create.
If you mean the original attempt (like Coman's tonight) that was wrongly-anticipated and badly-intercepted (to eventually lead to an own goal), it should and it is in the Infogol model for example.
But most own goals are failed attempts to intercept passes or crosses, so they inevitably do not get accounted.
Is that fair? Absolutely IMO.
We can say the same about any good passing combination that fails to add up to a final attempt.
xG stats target only final attempts. There are other stats that try to measure dominance before it becomes translated into final attempts.
2) Sum is not informative per se.
Simple example: 20 shots of 0.1 value add up to 2.0 xG.
4 shots of 0.5 value add up to 2.0 xG as well.
0.1 value chances most of the times do not go in.
0.5 value chances most of the times go in.
If you read only the sum you think the two teams created equally good chances. Not at all.
In the first case you have chances to score 0 or some times (with exceptional finishing) 1,
in the second case you have chances to score 4 unless there is some really bad finishing involved.
There is a big difference there. Any good reading of any xG score, should look at the shot-map as well.
3) If you take out the offside goal, and look at the attempts with their xG value: It still gives a good 2-5 or 2-4 scoreline.
Now what you say about your judgment after watching the game: I don't reject it.
But (look what I wrote on 1 above: dominance does not always gets translated into chances. Barcelona was dominant yesterday 1st half against Kiev, but no good chances...)
Salzburg had the better chances, no question about that.
4) Tottenham - Bayern involved some ludicrous finishing by Gnabry and Lewa. Definetely 2-7 did not do justice to Tottenham that night.
I don't see anything weird there. 2 good chances for Tottenham apart from the PK, 4 very good for Bayern.
5) Your point about the value being relative to the player is well taken, and I agree.
I have said that I believe the new generation of xG models will account for that (maybe for the keeper as well, although that's more difficult).
That does not mean it's shit right now.
It's the best tool available to measure quality of chances


 Great job.

