Memphis Depay

Bobo32

Senior Member
I have already done that once, when they posted it after the first 3 games:
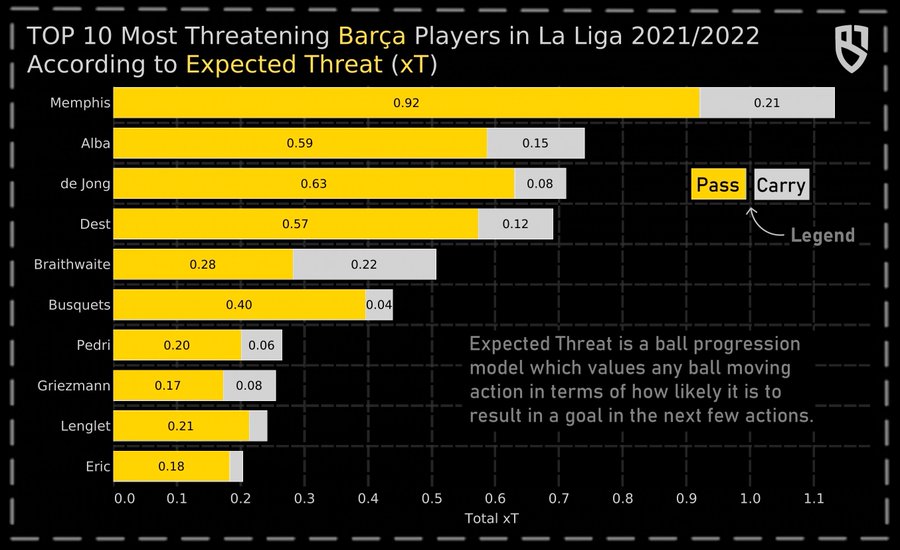
E_FT-aCWUAQgEVJ


Problem is I am not a Data Analytics employee, so I don't have access to all those databases after each game to post more about what happened after game 3.
I am sure the same pattern continued in xT

But I have other goodies for you that smash the stupid low success% charge against Depay:

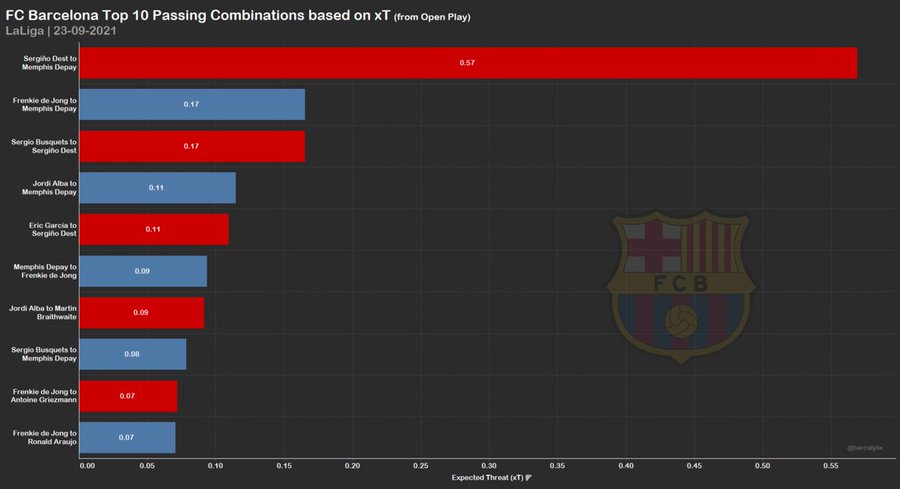
1) Top 10 passing combinations of the team based on xT
FAJ5PVXVQAEwYIj

Depay featuring in the - by far- top combination, but also in 3 out of the first 4

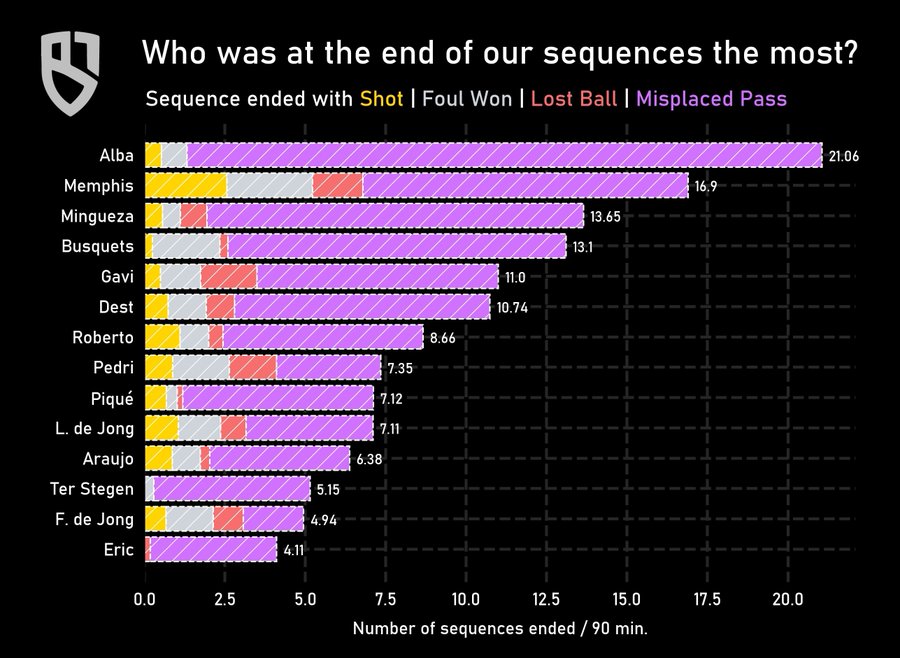
2) Here you see with which Barca player our passing sequences end:
FA9nlfmUcBEfqud

Memphis is 2nd behind Alba, but if you look at the analysis of the way the sequences end, you will see that he is the most productive of our end-sequence players,
as he takes a shot or wins a foul proportionately much more than all other players

PS-Bonus on how to use stats:
And here is an example of how someone (either naive or ill-disposed like you) can use a stat to distort reality:
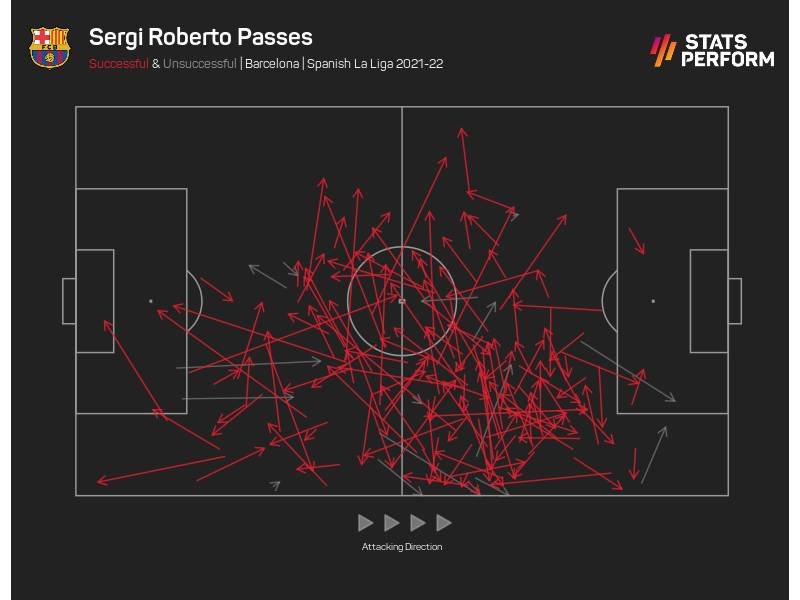
For instance, Sergi Roberto has recorded 90% of successful passed in the opposition box.
A na?ve person would say wow! that's a fantastic stat!
But let's look actually at his passes in some detail:
FA9zLjVUcAsU5mU

Yeah, that's only 4 passes attempted in the opposition box
which is TRAGICALLY LOW, given where he receives the ball, and what a better full-back could do from there
which is less than 5% of his total passes attempted

Ok, so first you criticize low sample rate, and claim another stat to be better, yet you don't even have access to that stat more than from the first three games, and then only by second or third hand :whistle:

1) Explain this picture to me first. What does 0,57 xT mean here? From what games do they take this stat?
2) Here I also want to know from what period this pic is. It is pretty obvious that most of Barcelonas thoughtless play end on either an Alba cross or a Depay attempt though. In what way is this good? If it ended in more than 3+1 goals over 9 games, it would be a bit better... A Depay shot that is converted 2/21 times, or gaining a freekick that is later not converted by Depay, isn't that great. Whatever Depay does (dribble, shoot, pass, try to recieve the ball etc) it's about a 50-50 chance that the ball is lost to the opponent.

I don't want to respond to the strawman about Robertos pretty nice passing map, but can just repeat that Roberto has made as many assists as Depay so far, and scored as many non-penalty goals, while playing less than half the minutes, mostly as a wing back and midfielder.
 

Birdy

Senior Member
Ok, so first you criticize low sample rate, and claim another stat to be better, yet you don't even have access to that stat more than from the first three games, and then only by second or third hand :whistle:

1) Explain this picture to me first. What does 0,57 xT mean here? From what games do they take this stat?
2) Here I also want to know from what period this pic is. It is pretty obvious that most of Barcelonas thoughtless play end on either an Alba cross or a Depay attempt though. In what way is this good? If it ended in more than 3+1 goals over 9 games, it would be a bit better... A Depay shot that is converted 2/21 times, or gaining a freekick that is later not converted by Depay, isn't that great. Whatever Depay does (dribble, shoot, pass, try to recieve the ball etc) it's about a 50-50 chance that the ball is lost to the opponent.

I don't want to respond to the strawman about Robertos pretty nice passing map, but can just repeat that Roberto has made as many assists as Depay so far, and scored as many non-penalty goals, while playing less than half the minutes, mostly as a wing back and midfielder.

Is it my fault that I don't have unrestricted access to it? Maybe it's my fault that I am not employed on soccer analytics?

The 1st pic, as I said, comes from the first 3 games.
The next one is until 29th of Sept
Same for the last one I think

The last pic shows that Depay tries something more than others: shot or at least wins a foul.
He misplaces less passes than Busi proportionately to his actions (which shatters the % propaganda)
As for the 2/21, I answered you yesterday with Messi's percentage on this
50-50 is fine for a player that tries to threaten, instead of just recycling the ball without doing anything that can result in a goal (your Puig-Masia pipe dream,
like playing Olmo as an attacker)

PS:
Ok, let's see about xT now,
the graph explains it itself, and I had posted a month ago a long article explaining the stat.
In short, I can summarize it in two lines as follows:
xT measures the change in the value (xG) when the ball progresses from position A to position B either by a pass or by a ball carry
The player who is responsible for the successful pass OR the successful ball carry is credited the xT increase.

Why is the stat important?
Because it gives some meaningfulness to otherwise neutral or misguiding stats,
like passing success %:
If a player passes always backwards or sideways he adds no xT value to the team for instance, and his contribution might be negative as well IF he selects those passes at the expense of becoming more threatening to the opposition (call me Roberto)
or like dribblin success %:
If a dribbler like to dribble, but does not increase xT through his dribbles, this habit is pretty much useless

What else do you need to know?
 

Bobo32

Senior Member
You post three pictures that you don't even know shit about yourself, while criticizing the stats I brought up. I should just end it there, but fine, I will reply once more.
Is it my fault that I don't have unrestricted access to it? Maybe it's my fault that I am not employed on soccer analytics?
Yes if you bring something to the table you should have access to it. Your picture from 3 games doesn't match my database stats from 9 games. If you criticize my stats from 9 games you can't bring a picture from the first 3 games and say "you think" it's the same after that.
The 1st pic, as I said, comes from the first 3 games.
The next one is until 29th of Sept
Same for the last one I think
"The next one" has the date 23 sept in it, so I doubt it is until 29th sept. What exactly does 0,57 mean?
The last pic shows that Depay tries something more than others: shot or at least wins a foul.
He misplaces less passes than Busi proportionately to his actions (which shatters the % propaganda)
As for the 2/21, I answered you yesterday with Messi's percentage on this
50-50 is fine for a player that tries to threaten, instead of just recycling the ball without doing anything that can result in a goal (your Puig-Masia pipe dream,
like playing Olmo as an attacker)
Yes he shoots a lot, and scores very little. He also falls a lot, and so far the ref whistles most of the time.
He does not misplace less passes than Busi in any way, what do you mean with "proportionately to his actions"?
Depay scores 0,09 of the shots he takes this season, Messis seasons range from 0,13 to 0,19.
50-50 is very bad, and influences the team very negatively.
PS:
Ok, let's see about xT now,
the graph explains it itself, and I had posted a month ago a long article explaining the stat.
In short, I can summarize it in two lines as follows:
xT measures the change in the value (xG) when the ball progresses from position A to position B either by a pass or by a ball carry
The player who is responsible for the successful pass OR the successful ball carry is credited the xT increase.

Why is the stat important?
Because it gives some meaningfulness to otherwise neutral or misguiding stats,
like passing success %:
If a player passes always backwards or sideways he adds no xT value to the team for instance, and his contribution might be negative as well IF he selects those passes at the expense of becoming more threatening to the opposition (call me Roberto)
or like dribblin success %:
If a dribbler like to dribble, but does not increase xT through his dribbles, this habit is pretty much useless

What else do you need to know?
lol do you want me to keep track of "long articles" you posted here a month ago?
Based on your contrived explanation of this stat, I think it is pretty much useless, and I don't think you really understand what it does or says.
 

Birdy

Senior Member
You post three pictures that you don't even know shit about yourself, while criticizing the stats I brought up. I should just end it there, but fine, I will reply once more.

Yes if you bring something to the table you should have access to it. Your picture from 3 games doesn't match my database stats from 9 games. If you criticize my stats from 9 games you can't bring a picture from the first 3 games and say "you think" it's the same after that.

"The next one" has the date 23 sept in it, so I doubt it is until 29th sept. What exactly does 0,57 mean?

Yes he shoots a lot, and scores very little. He also falls a lot, and so far the ref whistles most of the time.
He does not misplace less passes than Busi in any way, what do you mean with "proportionately to his actions"?
Depay scores 0,09 of the shots he takes this season, Messis seasons range from 0,13 to 0,19.
50-50 is very bad, and influences the team very negatively.

lol do you want me to keep track of "long articles" you posted here a month ago?
Based on your contrived explanation of this stat, I think it is pretty much useless, and I don't think you really understand what it does or says.

I understand it fine, thank you.
'I don't think you understand the stat' & 'I think it's useless' without explanation of either is not an answer,
more of an attempt to smooth your way out of the cornered position you are in atm
Right, Bobo??

Then
1) Sorry, I am not analyst!
LOL I can't believe I have to answer this.
This is not a simple stat like shots, pass % , etc that you can find everywhere.
You have to have access to the super-databases of analytics companies like Statsbomb.

Rest assured, when I see xT for all the games up to now getting posted again, I will re-post it here.

2) 0.57 is the increase in xT when Dest combines with Memphis
3) More accurately: "The percentage of misplaced passes in the total of all the sequences ended with him"
that is the pink part of the bar of each player in the graph
The pink part in Busi's graph covers more % of his bar than what the % of the pink bar of Memphis covers to his bar.
Can you see that on the graph?


Now, do you have any answer to all my points above?
WIll you ever say something about how Memphis is the most dangerous player we have atm (proved by how he increases our xT)
OR you will keep pretending these points were never made and hide behind the dribble and pass success %, which proves nothing by itself?
 

Bobo32

Senior Member
I understand it fine, thank you.
'I don't think you understand the stat' & 'I think it's useless' without explanation of either is not an answer,
more of an attempt to smooth your way out of the cornered position you are in atm
Right, Bobo??
Speak for yourself, I am in no corner. I am helping you enough to find your shortcomings already, maybe I'll explain later exactly how I drew these conclusions.
Then
1) Sorry, I am not analyst!
LOL I can't believe I have to answer this.
This is not a simple stat like shots, pass % , etc that you can find everywhere.
You have to have access to the super-databases of analytics companies like Statsbomb.

Rest assured, when I see xT for all the games up to now getting posted again, I will re-post it here.
When you see someone else compile stats (that you don't know how they work) you will post it again, fine.
Until then, don't criticize my stats by bringing an outdated thirdhand picture with graphs you think speak for your point.
2) 0.57 is the increase in xT when Dest combines with Memphis
No 0,57 is just a number, what exactly does it say? What does it mean here and what does it relate to? I understand it is related to an xG increase, but you will have to explain it in better detail.
3) More accurately: "The percentage of misplaced passes in the total of all the sequences ended with him"
that is the pink part of the bar of each player in the graph
The pink part in Busi's graph covers more % of his bar than what the % of the pink bar of Memphis covers to his bar.
Can you see that on the graph?
Do you understand that you are praising Depay for having a larger percentage of his own ball losses come from shots rather than passes? It makes no sense why you'd praise him for that.
Anyhow, this picture is outdated.
Now, do you have any answer to all my points above?
WIll you ever say something about how Memphis is the most dangerous player we have atm (proved by how he increases our xT)
OR you will keep pretending these points were never made and hide behind the dribble and pass success %, which proves nothing by itself?
I gave you the advice this spring to take a stat 101 course before trying to argue so strongly around stats here. Anyone who knows the least bit about it see that you have no clue about it.
I will continue to post success percentages of actions, actions per 90mins as well as absolute numbers, and compare them to other players, and more.
 

Birdy

Senior Member
Speak for yourself, I am in no corner. I am helping you enough to find your shortcomings already, maybe I'll explain later exactly how I drew these conclusions.

No 0,57 is just a number, what exactly does it say? What does it mean here and what does it relate to? I understand it is related to an xG increase, but you will have to explain it in better detail.

Do you understand that you are praising Depay for having a larger percentage of his own ball losses come from shots rather than passes? It makes no sense why you'd praise him for that.
Anyhow, this picture is outdated.

I gave you the advice this spring to take a stat 101 course before trying to argue so strongly around stats here. Anyone who knows the least bit about it see that you have no clue about it.
I will continue to post success percentages of actions, actions per 90mins as well as absolute numbers, and compare them to other players, and more.

- Dude, do you compile your stats by hand or you find them on some database?
YEs, please tell me that you compile them by hand or you run your own software on your pc
so that your idiotic statements trying to discredit professional accounts that post them as 'thirdhand' have any value

- Oh really Bobo?
You want me to send you my professional CV so that you can approve my participation in the discussion?
Piss off you patronizing bully..

YEs you are pretty well-cornered now, and try to pretend you are not by long-balling and distracting us from the main issue by raising non-issues like the ones above.
You get it why you are cornered yet??

Now, about the only real points you brought up in a 5 paragraph reply:

1) Yes, it's better to have a larger percentage of ending-sequences in shots than in misplaced passes.
Can't you see why?
I will let you find the answer yourself, it's easy

2) Did you understand the definition of xT I explained above?
If yes, I don't see what's the problem in understanding the 0.57 increase:
Dest passes to Depay and if one calculates *the times this combination is successful * differential increase of the xG value between position A(dest passing) to position B(Depay receiving), then you get the number you see there
 

Morten

Senior Member
[tw]1447639963974070278[/tw]

Memphis has now scored 35 goals for his country, level with Ruud van Nistelrooy. He?s just two behind Arjen Robben and Dennis Bergkamp and 15 off Robin van Persie.
At this rate he'll surpass van Persie and become the all-time leader in goals scored for the national soccer team of the Netherlands.

Stunning.

It feels like there many/most national teams are getting new top scorers these days, not surprising given how many matches they play compared to earlier.


Makes these scoring records kinda hollow imo, players of the past didnt get to play international games all the time.

That said, Memphis scoring rate with his NT is very good.
 

behindbrowneyes

Well-known member
It feels like there many/most national teams are getting new top scorers these days, not surprising given how many matches they play compared to earlier.


Makes these scoring records kinda hollow imo, players of the past didnt get to play international games all the time.

That said, Memphis scoring rate with his NT is very good.

I kinda agree, that's why I also looked at the goals per match ratio:
van Persie: 102 games - 50 goals - 0,49goals/match
Huntelaar: 76 games - 42 goals - 0,55goals/match
Kluivert: 79 games - 40 goals - 0,51goals/match
Wilkes: 39 games - 37 goals - 0,95goals/match
Bergkamp: 79 games - 37 goals - 0,47goals/match
Robben: 96 games - 37 goals - 0,39goals/match
vNistelrooy: 70 games - 35 goals - 0,50goals/match
Memphis: 73 games - 35 goals - 0,48goals/match

The only one that's really standing out here is Faas Wilkes and he was born in 1923, so we are speaking from a whole different game of football. Huntelaar was kinda surprising for me though. The fact that Memphis hardly ever scored in his first 30 games for the Netherlands makes his ratio look pretty good and shows that he developed a lot in that department. Of course, taking penalties is helping too.
 

Bobo32

Senior Member
- Dude, do you compile your stats by hand or you find them on some database?
YEs, please tell me that you compile them by hand or you run your own software on your pc
so that your idiotic statements trying to discredit professional accounts that post them as 'thirdhand' have any value
You don't even know from what time period the stats you use are from.
One of the big problems with using stats is the difficulty in definitions, and you seem completely unaware of any difficulties but are satisfied with a picture posted with some graphs and hope that if you repost it with some buzzwords, it will be impressive.
I am taking the numbers from fbref myself, and I can explain why I chose the different statistics, over what time, compare to others etc.
- Oh really Bobo?
You want me to send you my professional CV so that you can approve my participation in the discussion?
Piss off you patronizing bully..
You talk as if you know a lot about stuff you don't know very much about. I am not a statistician, but at least know some basic stuff and it is very obvious you don't. It is fine to discuss football and statistics even if you are no expert of course, but it kind of hurts my eyes to see you argue the way you do. But continue if you want, I tried to tell you in a nicer way previously that you are making a fool of yourself.
YEs you are pretty well-cornered now, and try to pretend you are not by long-balling and distracting us from the main issue by raising non-issues like the ones above.
You get it why you are cornered yet??
No I do not get it. I was the one posting some simple stats from this season, then you arrived and distracted by countering with long-balling contrived stats from the first three rounds, that you thought spoke against my "case".
If I am talking about success percentages, it does not impress that you bring up another statistic that neither of us even have access to, other than a twitter picture from a month ago. Of course if a player plays with more risk he will succeed less but should also be more dangerous, which Depay is to an extent, but so far he has not been very succesful. Sergi Roberto has been about as succesful, even playing less than half his minutes. Braithwaite as well.
1) Yes, it's better to have a larger percentage of ending-sequences in shots than in misplaced passes.
Can't you see why?
I will let you find the answer yourself, it's easy

2) Did you understand the definition of xT I explained above?
If yes, I don't see what's the problem in understanding the 0.57 increase:
Dest passes to Depay and if one calculates *the times this combination is successful * differential increase of the xG value between position A(dest passing) to position B(Depay receiving), then you get the number you see there
You don't see any problem with filtering out every time the combination is not succesful?
You say this is an average delta xT number for the times they make a succesful connection?
Did they filter out MatS in this? Every pass he makes to a forward should be an increase from 0,0.
Did you find out over exactly what time period this is taken from?

Your point of shot vs pass is a cheap one, and not true. If Busquets (who I refuse to believe ever misplaced more passes than Depay over a longer time period) would've started to shoot 10 times per game, turning over the ball, he wouldn't be praised for it, even if he would maybe score 2 goals.
 

Bobo32

Senior Member
I kinda agree, that's why I also looked at the goals per match ratio:
van Persie: 102 games - 50 goals - 0,49goals/match
Huntelaar: 76 games - 42 goals - 0,55goals/match
Kluivert: 79 games - 40 goals - 0,51goals/match
Wilkes: 39 games - 37 goals - 0,95goals/match
Bergkamp: 79 games - 37 goals - 0,47goals/match
Robben: 96 games - 37 goals - 0,39goals/match
vNistelrooy: 70 games - 35 goals - 0,50goals/match
Memphis: 73 games - 35 goals - 0,48goals/match

The only one that's really standing out here is Faas Wilkes and he was born in 1923, so we are speaking from a whole different game of football. Huntelaar was kinda surprising for me though. The fact that Memphis hardly ever scored in his first 30 games for the Netherlands makes his ratio look pretty good and shows that he developed a lot in that department. Of course, taking penalties is helping too.

Yeah I quickly checked these ratios yesterday. It is nice to be on the same level as van Nistelrooy, Kluivert and Bergkamp. Huntelaar surprisingly a bit better than all of them...
 

vegitot

Senior Member
Don't jump into this conversation but there are something that i want to point out. What Birdy really mean is Depay's low success % come with his multiple attempts. The more you attempt, the less success rate you will get (normally). Especially:

First, Depay is a forward, not a midfielder. Most of the time he does his stuffs in opponent half or final third where his success rate is obviously lower than if he does in midfield.

Second, it is Depay's ability. He doesn't have any world class ability actually. His dribbling ability mostly come from his tricks, not close control and body balance or super pace. So he fails more than he succeeds. He of course tries to show off too often.

Third, he is now Barca's ace. His teammates look at him like that so they pass the ball to him and expect him to do some miracle. When you are treated as the ace of your team, you will try to do anything possible. Will fail more than often if you are not the world best. It is Depay's case.

After all, Depay is still Barca's best attacker now. Using some basic stats, he creates 2,4 chances per game in Liga which is pretty good. 3 goals and 1 assists in 7 games so far isn't bad. If his teammates can finish better then he will have more assists or if he isn't wasteful or shows off, he will score more.

Bobo bashes any player that isn't named :puig:
 

Birdy

Senior Member
[MENTION=29755]Bobo32[/MENTION]
One thing I appreciate in you is that you continue responding and not quit - unlike others.
One thing I don't appreciate, is that you resort to ad-honimem attacks (of the patronizing type "you need to take stats 101" , or "you don't understand the stats") when you appear to lose the argument
I am polite twds you, I never attack you personally despite attacking your points
It's kind of denigrating to turn an argument into a personal attack, isn't it?

Besides, if I really haven't understood the stats I am posting I couldn't explain them. But I am patiently explaining everything to you, answering all your questions and objections.
So I kindly ask you to stick to the argument, and not roam out of bounds.

About my sources, I already answered. xT is a new stat, it will take time to get included in databases.
FBref I visit daily, and I brought it here in BF for the first time.

Now, let's talk about the real issue.

I have a consistent argument, which I am only backing with stats.
My argument is not plain stats without any thesis, as you make it out to be.

My argument is:
Attackers like Depay shall not be measured on the success% of circulating possession, as this is a necessary trait of a md and not an attacker.
It's not bad to have it, but there are other traits that are much more important.

Like breaking into deep blocks of the opposition, either by dribbling into dangerous areas, or by passing into dangerous areas, or by scoring themselves.
Guess what: we have a new stat available that can actually measure the danger a player inflicts on the opposition, and it's the xT increase
Depay does that well enough. The proof is how well he features in all xT metrics
Of course there are other WC players that can do it better.

Your point is that Depay features low in % ball circulation.
But we are talking about an attacker, not a md, and an attacker who does not threaten enough, but is excellent in circulating the ball (like Pedri, Puig of Gavi IF played as wingers or wide forwards, or even false 9s, would have been) does not cut it for those positions that need the ability to actually threaten.

You don't see any problem with filtering out every time the combination is not succesful?
You say this is an average delta xT number for the times they make a succesful connection?
Did they filter out MatS in this? Every pass he makes to a forward should be an increase from 0,0.
Did you find out over exactly what time period this is taken from?

Your point of shot vs pass is a cheap one, and not true. If Busquets (who I refuse to believe ever misplaced more passes than Depay over a longer time period) would've started to shoot 10 times per game, turning over the ball, he wouldn't be praised for it, even if he would maybe score 2 goals.

Yes, it takes into account only successful actions (passes, ball carries) as an unsuccessful one does not actually increase xT, but fails to.
Don't know if they included MATS stats there, it's besides the point probably to do so as they were evaluating outfield players.

Busi does not misplace more passes in general. You misunderstood the graph.
It says that of the total passing sequences, IN WHICH the last Barca player involved was Busi:
x% of them featured a misplaced pass
y% of them featured a shot taken
z% of them featured a foul won
etc

If one counts just the number of misplaced passes Depay might have more than Busi, but as % of all ending-sequence actions,
Depay has less, because more % of his sequences end with a foul won or a shot taken.

For an ATTACKER, that is much better than having him end all or most of the sequences with a failed pass.
That's not an attack on Busi, who is a md
It's a defense of Depay
 

Bobo32

Senior Member
I am very kind hearted, well mannered and patient, so I try to answer, even though I probably shouldn't, as neither of us seem to learn much from it. It takes time.
It is not ad hominem, but I am very sure that you have a lot to learn, and if you did, our arguments could be of more use to both of us. More than that, I think you'd enjoy it since you clearly have an interest in it.
You are mostly polite too, that is nice and one reason I feel I should reply.
[MENTION=29755]Bobo32[/MENTION]
Yes, it takes into account only successful actions (passes, ball carries) as an unsuccessful one does not actually increase xT, but fails to.
Don't know if they included MATS stats there, it's besides the point probably to do so as they were evaluating outfield players.

Busi does not misplace more passes in general. You misunderstood the graph.
It says that of the total passing sequences, IN WHICH the last Barca player involved was Busi:
x% of them featured a misplaced pass
y% of them featured a shot taken
z% of them featured a foul won
etc

If one counts just the number of misplaced passes Depay might have more than Busi, but as % of all ending-sequence actions,
Depay has less, because more % of his sequences end with a foul won or a shot taken.

For an ATTACKER, that is much better than having him end all or most of the sequences with a failed pass.
That's not an attack on Busi, who is a md
It's a defense of Depay
In the graph it looks like the absolute number of passes lost were greater by Busquets than by Depay, which makes me doubt the graph.
You did not answer about the time scale of the xT graph, and you didn't answer exactly how the number is calculated. I want you to focus on just this graph now and answer these two things first.

---
As I have written many times, almost in every reply to you, it is obvious that an attacker, with license to play with high risk, will (and even should) fail a lot more than a midfielder. He will also score more goals and assists hopefully, I am sure Depays numbers will rise a bit over time. You have to relate them to each other, which I do, and so far the relation is terrible for Depay.
 

Birdy

Senior Member
In the graph it looks like the absolute number of passes lost were greater by Busquets than by Depay, which makes me doubt the graph.
You did not answer about the time scale of the xT graph, and you didn't answer exactly how the number is calculated. I want you to focus on just this graph now and answer these two things first.

1) I think it looks from the graph that the pink area is roughly the same in size for both, which is per 90 min
IF you look at the absolute number of misplaced passes on FBreF Busi has 11.2 misplaced per 90, while Memphis has 12.3 misplaced per 90,
that's very close numbers
It's made by this soccer analyst, I wouldn't doubt his credibility...

2) You mean the passing combination xT graph?
Here is the source.
Published on Sept. 23th -> it does not include the Levante and Atleti game then
(which it even makes the point stronger, since including the Dest-Depay combination of the Levante game would have bumped upwards the number even more emphatically)

It includes only open play passes, not crosses, not set-pieces.
The number is calculated as I explained already:
If Dest from position A successfully passes to Depay in position B,
then the difference in xG value of the two positions xG-xG[A] gives you the increase in xT
If you add up all those increases of all successful combinations of all Barca players, you get the graph.

Bear in mind that the publishers say that the Dest-Depay combination also topps the xT charts in whole of LaLiga.
 

Home of Barca Fans

Top