Memphis Depay

Bobo32

Senior Member
1) I think it looks from the graph that the pink area is roughly the same in size for both, which is per 90 min
IF you look at the absolute number of misplaced passes on FBreF Busi has 11.2 misplaced per 90, while Memphis has 12.3 misplaced per 90,
that's very close numbers
It's made by this soccer analyst, I wouldn't doubt his credibility...

2) You mean the passing combination xT graph?
Here is the source.
Published on Sept. 23th -> it does not include the Levante and Atleti game then
(which it even makes the point stronger, since including the Dest-Depay combination of the Levante game would have bumped upwards the number even more emphatically)

It includes only open play passes, not crosses, not set-pieces.
The number is calculated as I explained already:
If Dest from position A successfully passes to Depay in position B,
then the difference in xG value of the two positions xG-xG[A] gives you the increase in xT
If you add up all those increases of all successful combinations of all Barca players, you get the graph.

Bear in mind that the publishers say that the Dest-Depay combination also topps the xT charts in whole of LaLiga.


1) Yeah, Busquets is significantly worse here than previous seasons, but roughly 10 passes per game gives a 90% when you pass 100 times of course yes, but somewhere around 70% when you pass around 40 times per game. I didn't think to count that way before, but it's of course correct.
But Busquets bar goes from roughly 2,5 (one of many reasons another mans graphic isn't good to use is you can't even know the exact number in a case like this) to 13,1 (meaning a bit over 10 per game) while Depays goes from roughly 7 to 16,9, and I don't think Depay was ever under 10 passes missed per game. This is what confused me when I tried to understand the time period for that graph, but of course even a pass success data is up to what you count for a success, maybe they are from different counts.
Busquets misplaced passes: 5, 16, 11, 2, 12, 11, 7, 4, 13 (81 total, I think since the fourth game he has been under 10 per game total, he is on exactly 9 per game right now)
Depay: 10, 12, 10, 9, 10, 17, 12, 17, 15 (112 total misplaced passes, giving 12,4 misplaced passes per game)
I guess your numbers are only from the league so the numbers will be slightly different - but hey! I asked only because the bars seemed a bit off to me. I still think they do, they must be from the first three games and not take its data from fbref.

2) Yes I meant that graph. It's not really a source, and when a guy asked him to share his code, he just answered "I made it on Tableau" lol
I knew everything you wrote here from that link, but can you tell me, is the number a mean from the games, or an absolute number?
 

Birdy

Senior Member
1) Yeah, Busquets is significantly worse here than previous seasons, but roughly 10 passes per game gives a 90% when you pass 100 times of course yes, but somewhere around 70% when you pass around 40 times per game. I didn't think to count that way before, but it's of course correct.
But Busquets bar goes from roughly 2,5 (one of many reasons another mans graphic isn't good to use is you can't even know the exact number in a case like this) to 13,1 (meaning a bit over 10 per game) while Depays goes from roughly 7 to 16,9, and I don't think Depay was ever under 10 passes missed per game. This is what confused me when I tried to understand the time period for that graph, but of course even a pass success data is up to what you count for a success, maybe they are from different counts.
Busquets misplaced passes: 5, 16, 11, 2, 12, 11, 7, 4, 13 (81 total, I think since the fourth game he has been under 10 per game total, he is on exactly 9 per game right now)
Depay: 10, 12, 10, 9, 10, 17, 12, 17, 15 (112 total misplaced passes, giving 12,4 misplaced passes per game)
I guess your numbers are only from the league so the numbers will be slightly different - but hey! I asked only because the bars seemed a bit off to me. I still think they do, they must be from the first three games and not take its data from fbref.

2) Yes I meant that graph. It's not really a source, and when a guy asked him to share his code, he just answered "I made it on Tableau" lol
I knew everything you wrote here from that link, but can you tell me, is the number a mean from the games, or an absolute number?

About 2:
It does not indicate,
But the number is waaaay to big to be a mean from all games.
It's the total until the day indicated
 

Bobo32

Senior Member
About 2:
It does not indicate,
But the number is waaaay to big to be a mean from all games.
It's the total until the day indicated

Yeah I know it does not indicate.
And yeah it cannot really be a mean I don't think.

Anyway, to be very diplomatic, this stat is a peripheral curiosity at best, that can maybe be useful for some specific issue, not something to look at blindly.
That Depay is on the recieving end of many xT increasing passes says a lot more about the passer than him, and also that he should be involved in a lot of goals (simply because it indirectly indicates he recieves it in good spots, not because he gets it from worse spots a lot). You will probably claim that he is so great without the ball and gets into a lot of good positions, but it doesn't really say that.
It is also hard to visualize exactly what the numbers mean. Barcelona had scored 7 goals at that point, and had an xG of about 5, how to judge these xT increases where the greatest number is 0,57 and all the pic of the best 10 combinations adds up to about 2 goals max...

Just some points from the top of my head, that should be pretty obvious:
*Longer passes will be of inherently more worth, as will passes from the flanks. Does most goals involve crosses or long balls? Is this the way Barcelona should play?
*Recieving the ball in the six-yard box gives an xT of about 0,4. Any pass from outside of the area is pretty much under 0,1, and any pass from the own half is under 0,01. A pass into the 6yard eats up alot of good passes on the own half for example.
* The stat doesn't take the positions of the defending team into account! Or the attacking team!
*Depay recieving a pass from Pique with his back against the goal and four defenders marking him will be of higher xT increase than him getting a 1v1 with the keeper in the same spot from a Busquets pass
*Pairing players together isn't useful when judging single players, to judge Depay you should have one stat for the xT increase when he recieves the ball, and one when it leaves him, independent of where it goes
*Filtering out missed passes makes the stat pretty useless from the start, as there is a decrease in xT from every missed pass too.

There are just extremely many flaws with this stat. Over one season, it might indicate very specific stuff, but to use it after three games is just ridiculous.
 

Birdy

Senior Member
Yeah I know it does not indicate.
And yeah it cannot really be a mean I don't think.

Anyway, to be very diplomatic, this stat is a peripheral curiosity at best, that can maybe be useful for some specific issue, not something to look at blindly.
That Depay is on the recieving end of many xT increasing passes says a lot more about the passer than him, and also that he should be involved in a lot of goals (simply because it indirectly indicates he recieves it in good spots, not because he gets it from worse spots a lot). You will probably claim that he is so great without the ball and gets into a lot of good positions, but it doesn't really say that.
It is also hard to visualize exactly what the numbers mean. Barcelona had scored 7 goals at that point, and had an xG of about 5, how to judge these xT increases where the greatest number is 0,57 and all the pic of the best 10 combinations adds up to about 2 goals max...

Just some points from the top of my head, that should be pretty obvious:
*Longer passes will be of inherently more worth, as will passes from the flanks. Does most goals involve crosses or long balls? Is this the way Barcelona should play?
*Recieving the ball in the six-yard box gives an xT of about 0,4. Any pass from outside of the area is pretty much under 0,1, and any pass from the own half is under 0,01. A pass into the 6yard eats up alot of good passes on the own half for example.
* The stat doesn't take the positions of the defending team into account! Or the attacking team!
*Depay recieving a pass from Pique with his back against the goal and four defenders marking him will be of higher xT increase than him getting a 1v1 with the keeper in the same spot from a Busquets pass
*Pairing players together isn't useful when judging single players, to judge Depay you should have one stat for the xT increase when he recieves the ball, and one when it leaves him, independent of where it goes
*Filtering out missed passes makes the stat pretty useless from the start, as there is a decrease in xT from every missed pass too.

There are just extremely many flaws with this stat. Over one season, it might indicate very specific stuff, but to use it after three games is just ridiculous.

In short:
It says more about the passer, I agree, but it also says something about the receiver.
However, when you see Memphis topping the individual xT charts, it says everything about him, whether it's passes or ball carries
Sure, let's wait to have more data available, 3 games are def. not enough

Just to get a sense of what to expect, I posted here some time ago the graph from the same analytics guy of the individual xT by passing of all Barca player for 20/21 all season long (La Liga only. In general -unfortunately- most databases have league data only) and as expected Messi was first,
alba was 2nd, and surprise, surprise, King Dembouz was 3rd above Busi
And here is the same graph for xT received for all players in 20/21, where you see Braithwaite is 1st

About your questions:
"Is this the way Barcelona should play?" I don't think it indicates a way to play.
It's obvious that if a team manages to make successful progressive crosses they are doing sth good.
But it doesn't HAVE to be that necessarily.
It's more about realizing when you pose danger or threat to the opposition, and that's by penetrating into areas by either successful passing or successful ball carrying

"A pass into the 6yrd eats up good passes on the own half"
Of course, it 'eats them up' because *IF SUCCESSFUL* it's more important in posing threat

"Positions of defending/attacking team"
I don't know about that, have to look it up, not sure what you write about PiqueVsBusi pass is correct
"Pairing players"
There are individual stats, like the one above from 20/21
"Filtering"
I don't think it's correct to say there is a decrease in xT when a pass is misplaces.
A decrease in xT is with a back-pass for instance (the ones Roberto is so good at...)

I get your annoyance with misplaced passes.
But you have to understand correct passing is not no1 desideratum from a player whose main responsibility is to threaten, and eventually score or assist
 

Bobo32

Senior Member
In short:
It says more about the passer, I agree, but it also says something about the receiver.
However, when you see Memphis topping the individual xT charts, it says everything about him, whether it's passes or ball carries
Sure, let's wait to have more data available, 3 games are def. not enough
When you see passes to him from both WBs and Frenkie de Jong topping after three games played, it tells you that he recieved a lot of passes from these worse positions in these three games.
Just to get a sense of what to expect, I posted here some time ago the graph from the same analytics guy of the individual xT by passing of all Barca player for 20/21 all season long (La Liga only. In general -unfortunately- most databases have league data only) and as expected Messi was first,
alba was 2nd, and surprise, surprise, King Dembouz was 3rd above Busi
And here is the same graph for xT received for all players in 20/21, where you see Braithwaite is 1st
These graphs over one season could potentially say something, and when it's players instead of pairs, it tells you more about the individual players.
But it's still not saying that much. Messi and Alba were the main men in playing breaking, final, passes, as anyone saw. Dembele is shit but tries difficult passes, it is no surprise to anyone he'd be decent in this stat.
What to make of Braithwaite being on the receiving end a lot (like Depay in the first 3 games this season)? Was he the best player last season? The best without the ball?
"Is this the way Barcelona should play?" I don't think it indicates a way to play.
The one doing the graphs thought so, he said that he thought the numbers highlighted Barcelonas reliance on crosses and wing play.
I don't think it tells that much about anything to be honest, but the thing it sort of tells is who is allowed to play with higher risk.
It's obvious that if a team manages to make successful progressive crosses they are doing sth good.
But it doesn't HAVE to be that necessarily.
It's more about realizing when you pose danger or threat to the opposition, and that's by penetrating into areas by either successful passing or successful ball carrying
You can penetrate without having individual passes that score high on these xT delta stats. Your numbers only include passes, and it is inherently faulty that just the xT increasing pass should count. The same way that he has forward iterations to xT numbers for areas, he should have backwards iterations before the xT increasing passes, if he was to find the EV for the players performances. And that number would include faulty passes and actions of course.
"A pass into the 6yrd eats up good passes on the own half"
Of course, it 'eats them up' because *IF SUCCESSFUL* it's more important in posing threat
No it is not more important.
The 6 yard is awarded this 0,4 number, but this number comes from including cutback passes etc, the shortest pass you can imagine recieved in that area is very dangerous and helps give the area its xT, but these passes gives very little xT delta
A long ball from Pique that is recieved by Depay in the "best" 6yard spot, will most of the time be hard to control, and maybe he'll have to take it towards the corner etc, but it will score the highest xT delta score.
It is a very simplistic stat missing a lot of essential information, and it's very easy to see many flaws with it.
"Positions of defending/attacking team"
I don't know about that, have to look it up, not sure what you write about PiqueVsBusi pass is correct
It is correct, but please look it up.
"Pairing players"
There are individual stats, like the one above from 20/21
If you had posted stats like these, you would have more of a case and I would be less unimpressed, but still very unimpressed.
The guy posting the stats from last season thought the sample size of Pjanic was too small to include in the pic you posted above btw, he played more than twice what Depay had done in the pic you posted. He also thought Dembeles sample size was only decent, and Dembele had played 6,5 times more than Depay had done after three games.
"Filtering"
I don't think it's correct to say there is a decrease in xT when a pass is misplaces.
A decrease in xT is with a back-pass for instance (the ones Roberto is so good at...)
Of course it is correct.
If Roberto passed it back to ter Stegen, the xT value would still be slightly positive. When the ball is at the opponents hand, the xT value will be negative.
The xT is also calculated with future iterations in mind, and the reason the flanks for example have pretty positive numbers is that it includes backwards passes. It is very narrowminded to disregard backwards passes.
I get your annoyance with misplaced passes.
But you have to understand correct passing is not no1 desideratum from a player whose main responsibility is to threaten, and eventually score or assist
You have to understand that I understand some players are allowed to take risks to threaten.
Depay gets total allowance to take these risks, he takes all the set pieces, and he doesn't really defend, but he has very little to show for it so far. Once again I will mention that Roberto has as many non-penalty goals and assists as him, playing less than half the minutes, much of them as a defender.
This will probably change over time, but an xT combination graph from matchday 3, where he is on the recieving end of a lot of position improving passes, says very little about it. And it is not the case that Depay threatens a lot when he makes most of his mistakes, many of the mistakes are just sloppy, shitty, unconcentrated poor technique.
 

Joan

Well-known member
He's alright, but he's giving away those balls like they're candies.

But the pen was something else. Poor Cillessen didn't have time to blink.
 

malvolio

Senior Member
He's alright, but he's giving away those balls like they're candies.

adds unnecessary flicks and tricks when situation demands he releases the ball fast.

or holds up ball for no reason.

that's why i don't think any serious club went in for him while at lyon. too much of a luxury player.

guardiola or klopp would have subbed him off at HT if he pulled off shit like that.
 

Rory

Senior Member
Was in position for and gave a good wall pass for the Fati goal. Of course the finish is everything but to give no credit to Depay in laying it off just right isn’t fair.
 

Birdy

Senior Member
[MENTION=29755]Bobo32[/MENTION]

Here are the answers to the issues you are raising on Depay in graphs:

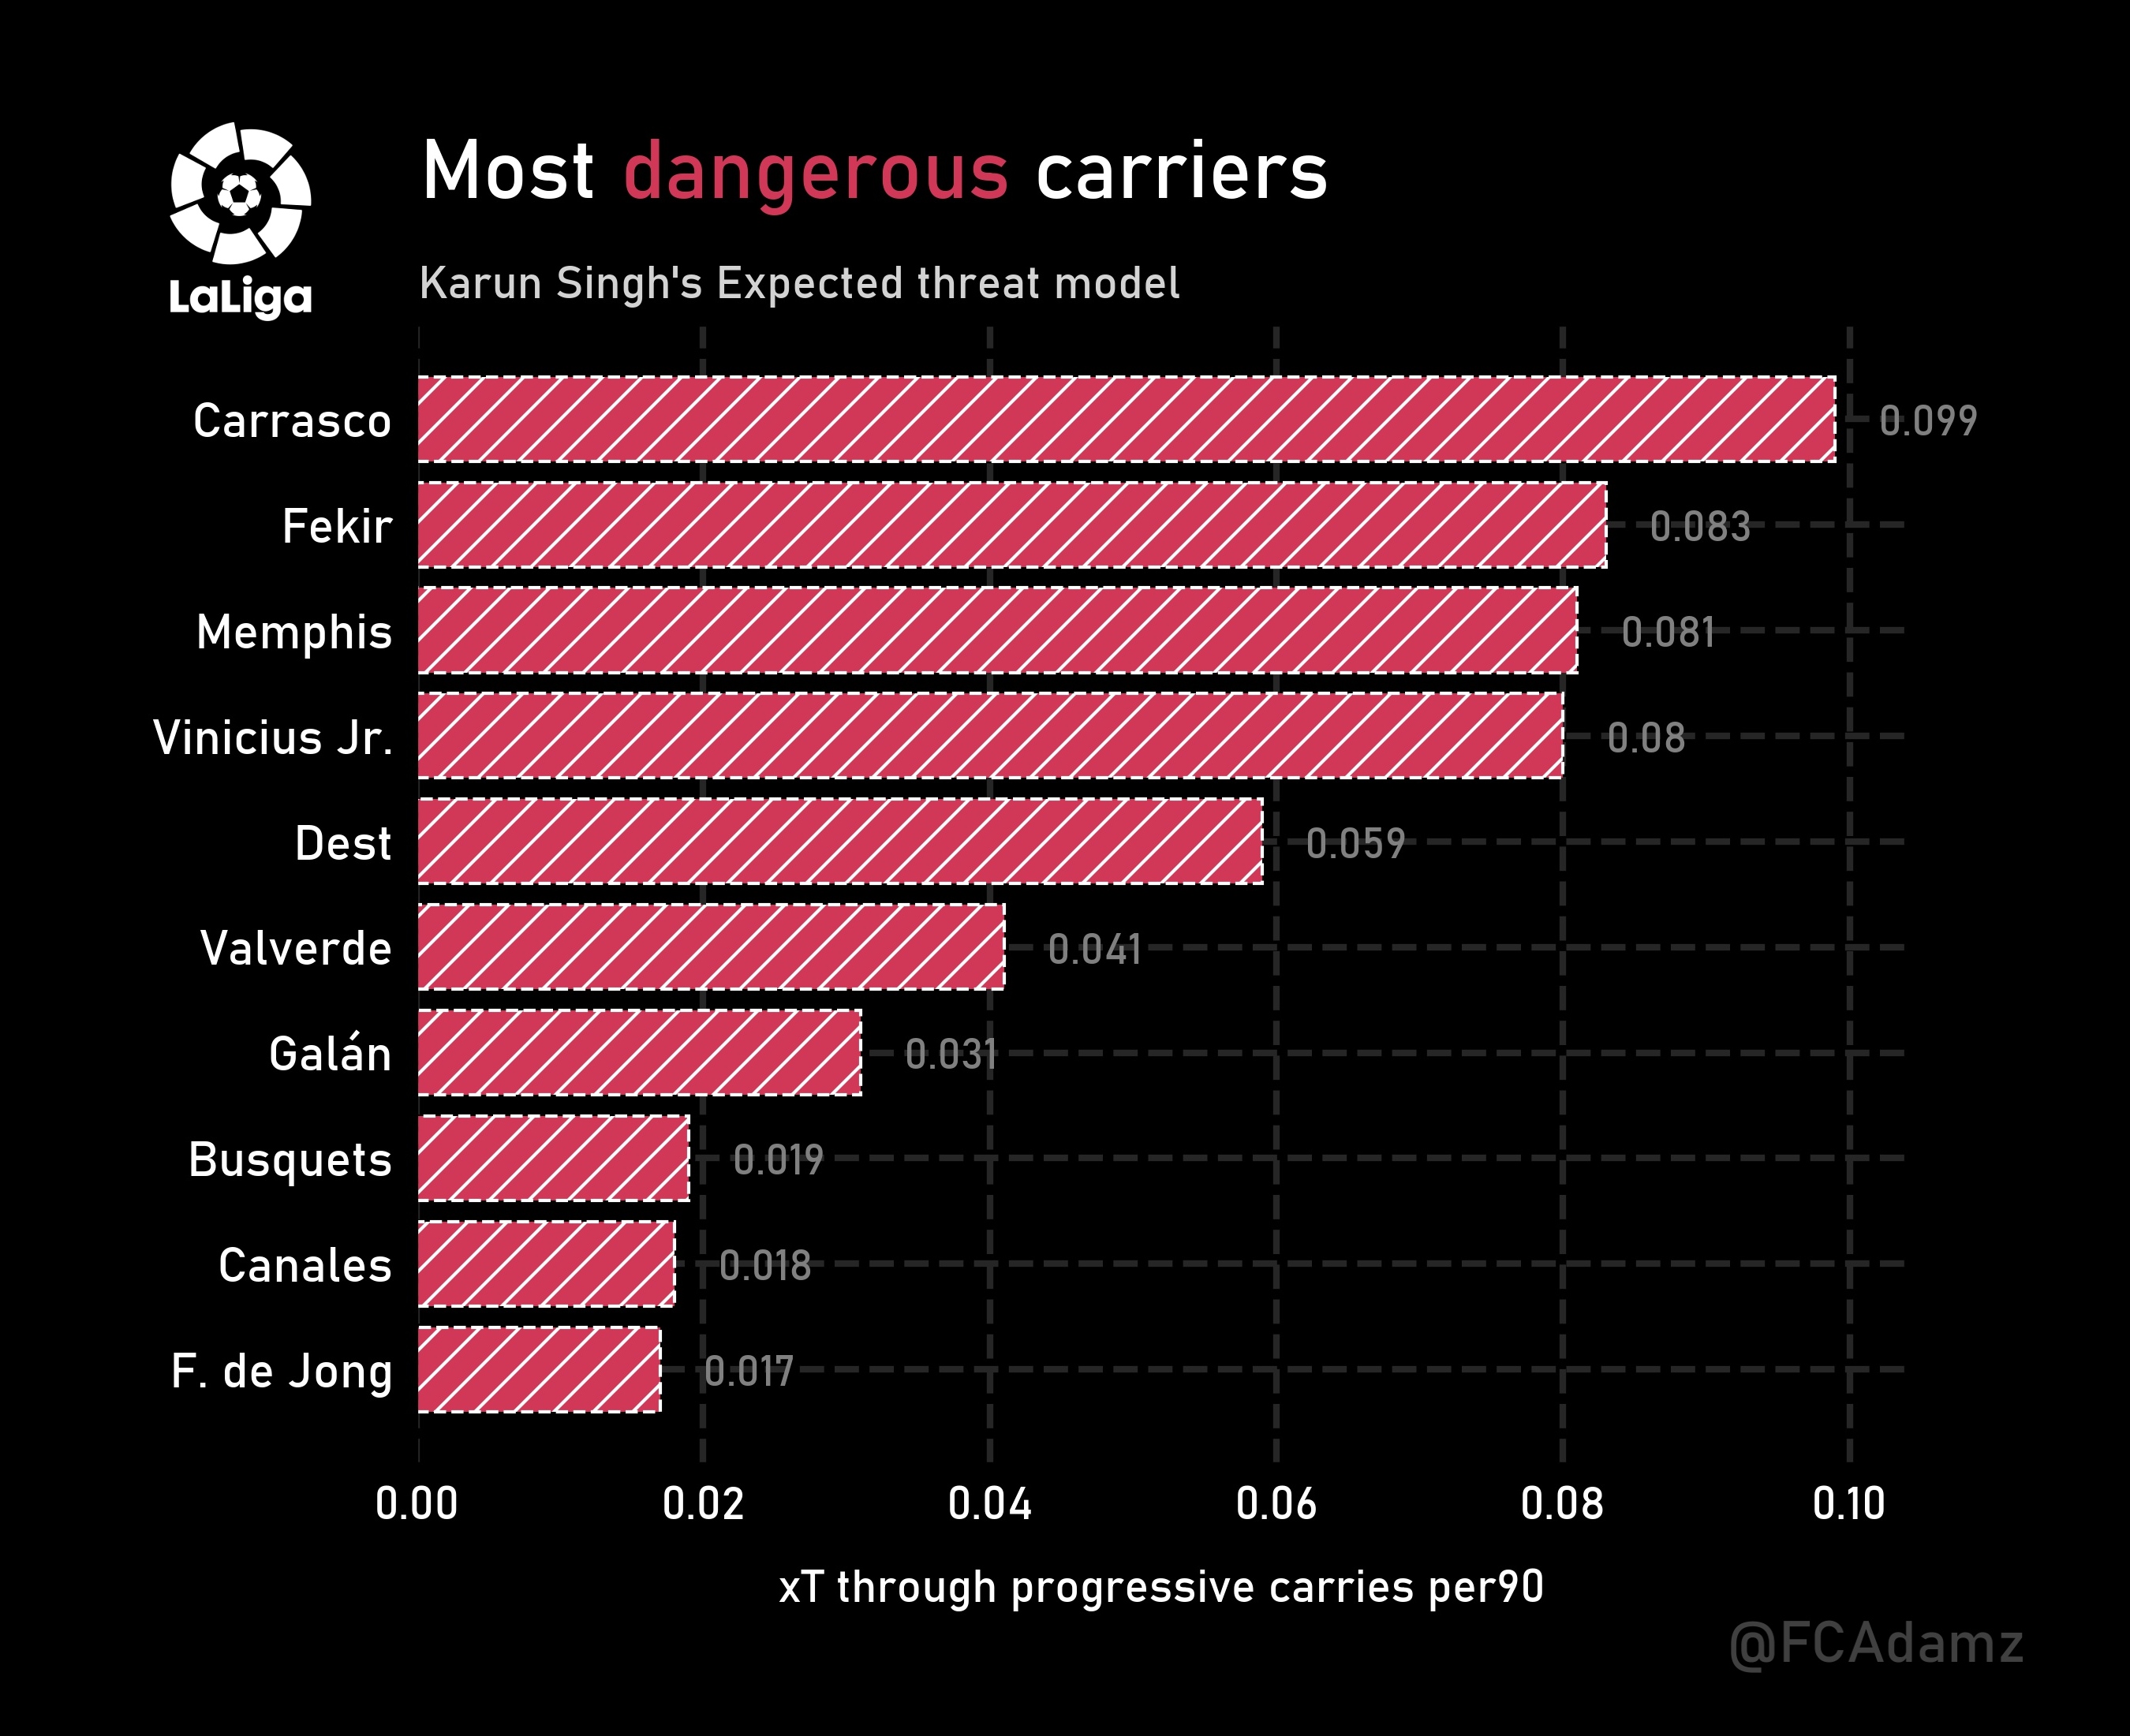
Excellent thread on twitter by football analyst FCAdamz:

1) Depay creates DANGER, by driving with the ball into dangerous areas
FBxDE9pWYAcPY4B

3rd in whole LaLiga in xT through progressive carries/90

(knowing that you gonna ask me about the calculation: I have explained already the definition of xT and I think you understand it now.
What they add here is that they calculated only the xT added through a progressive runs made by each player)

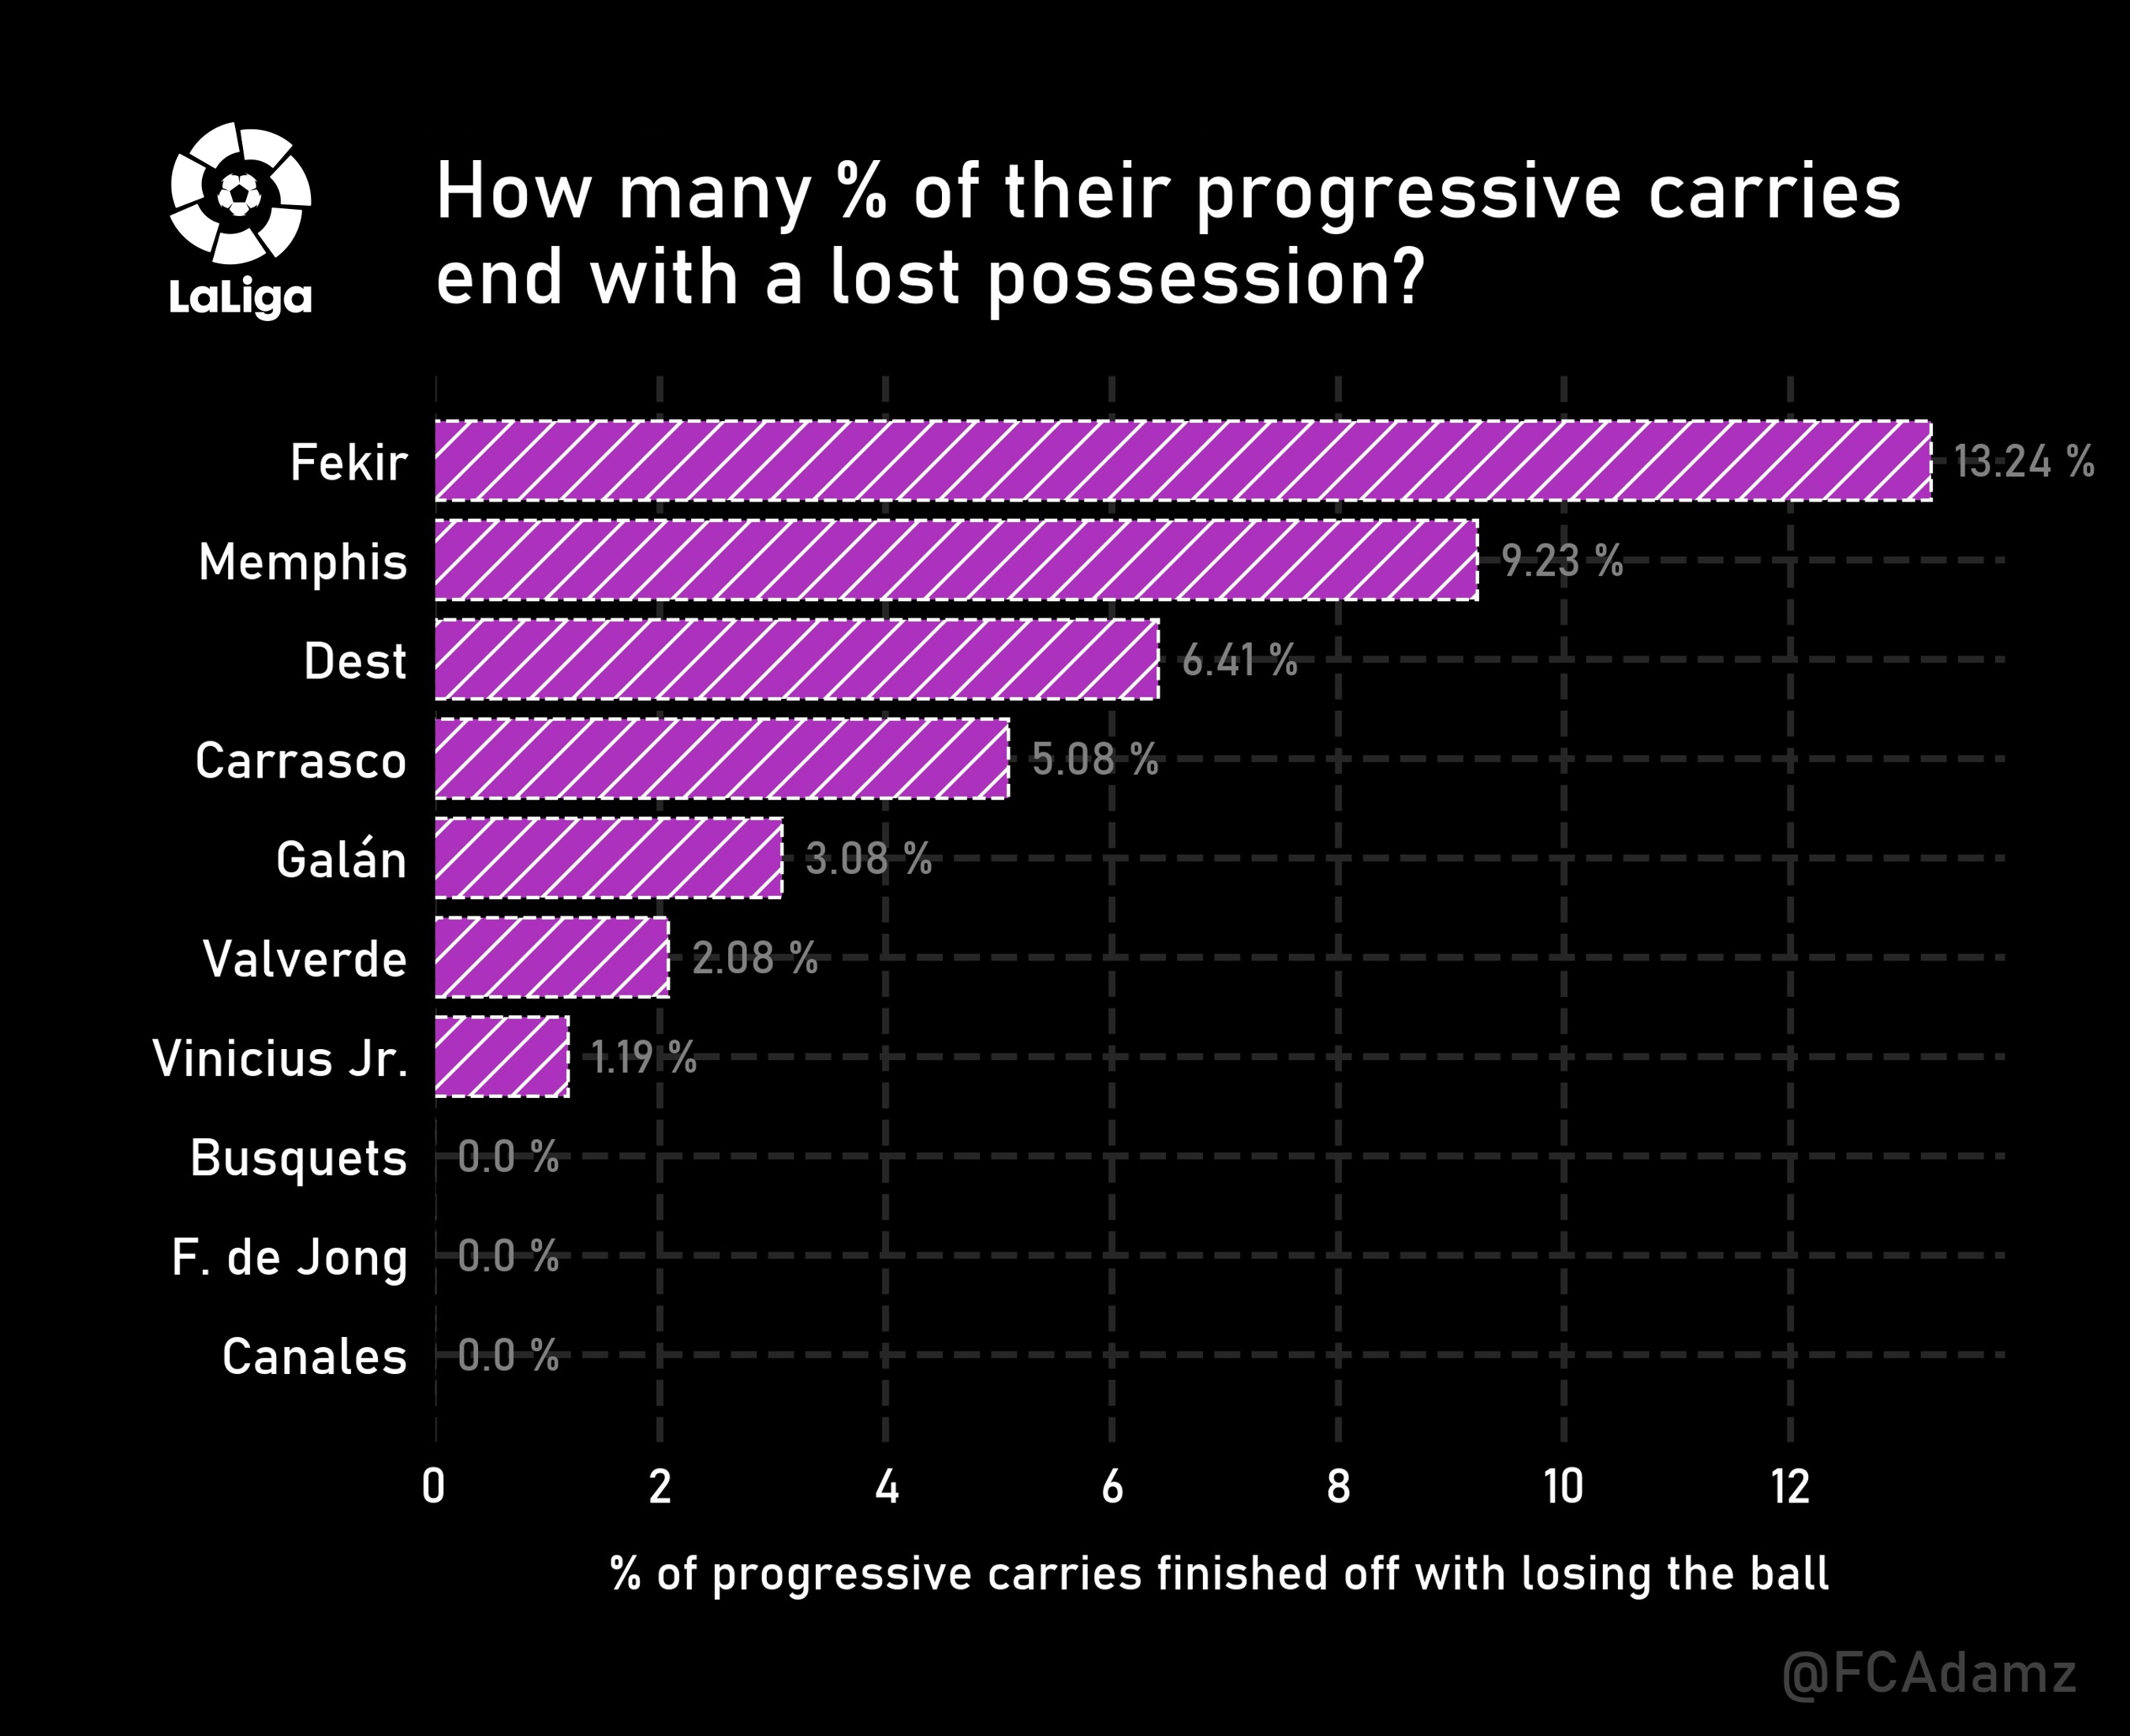
2) Which, as expected, means he would lose possession more often than 'safe-option' merchants who don't risk to drive with the ball into dangerous areas
FBxDhDJXoAsUIhR


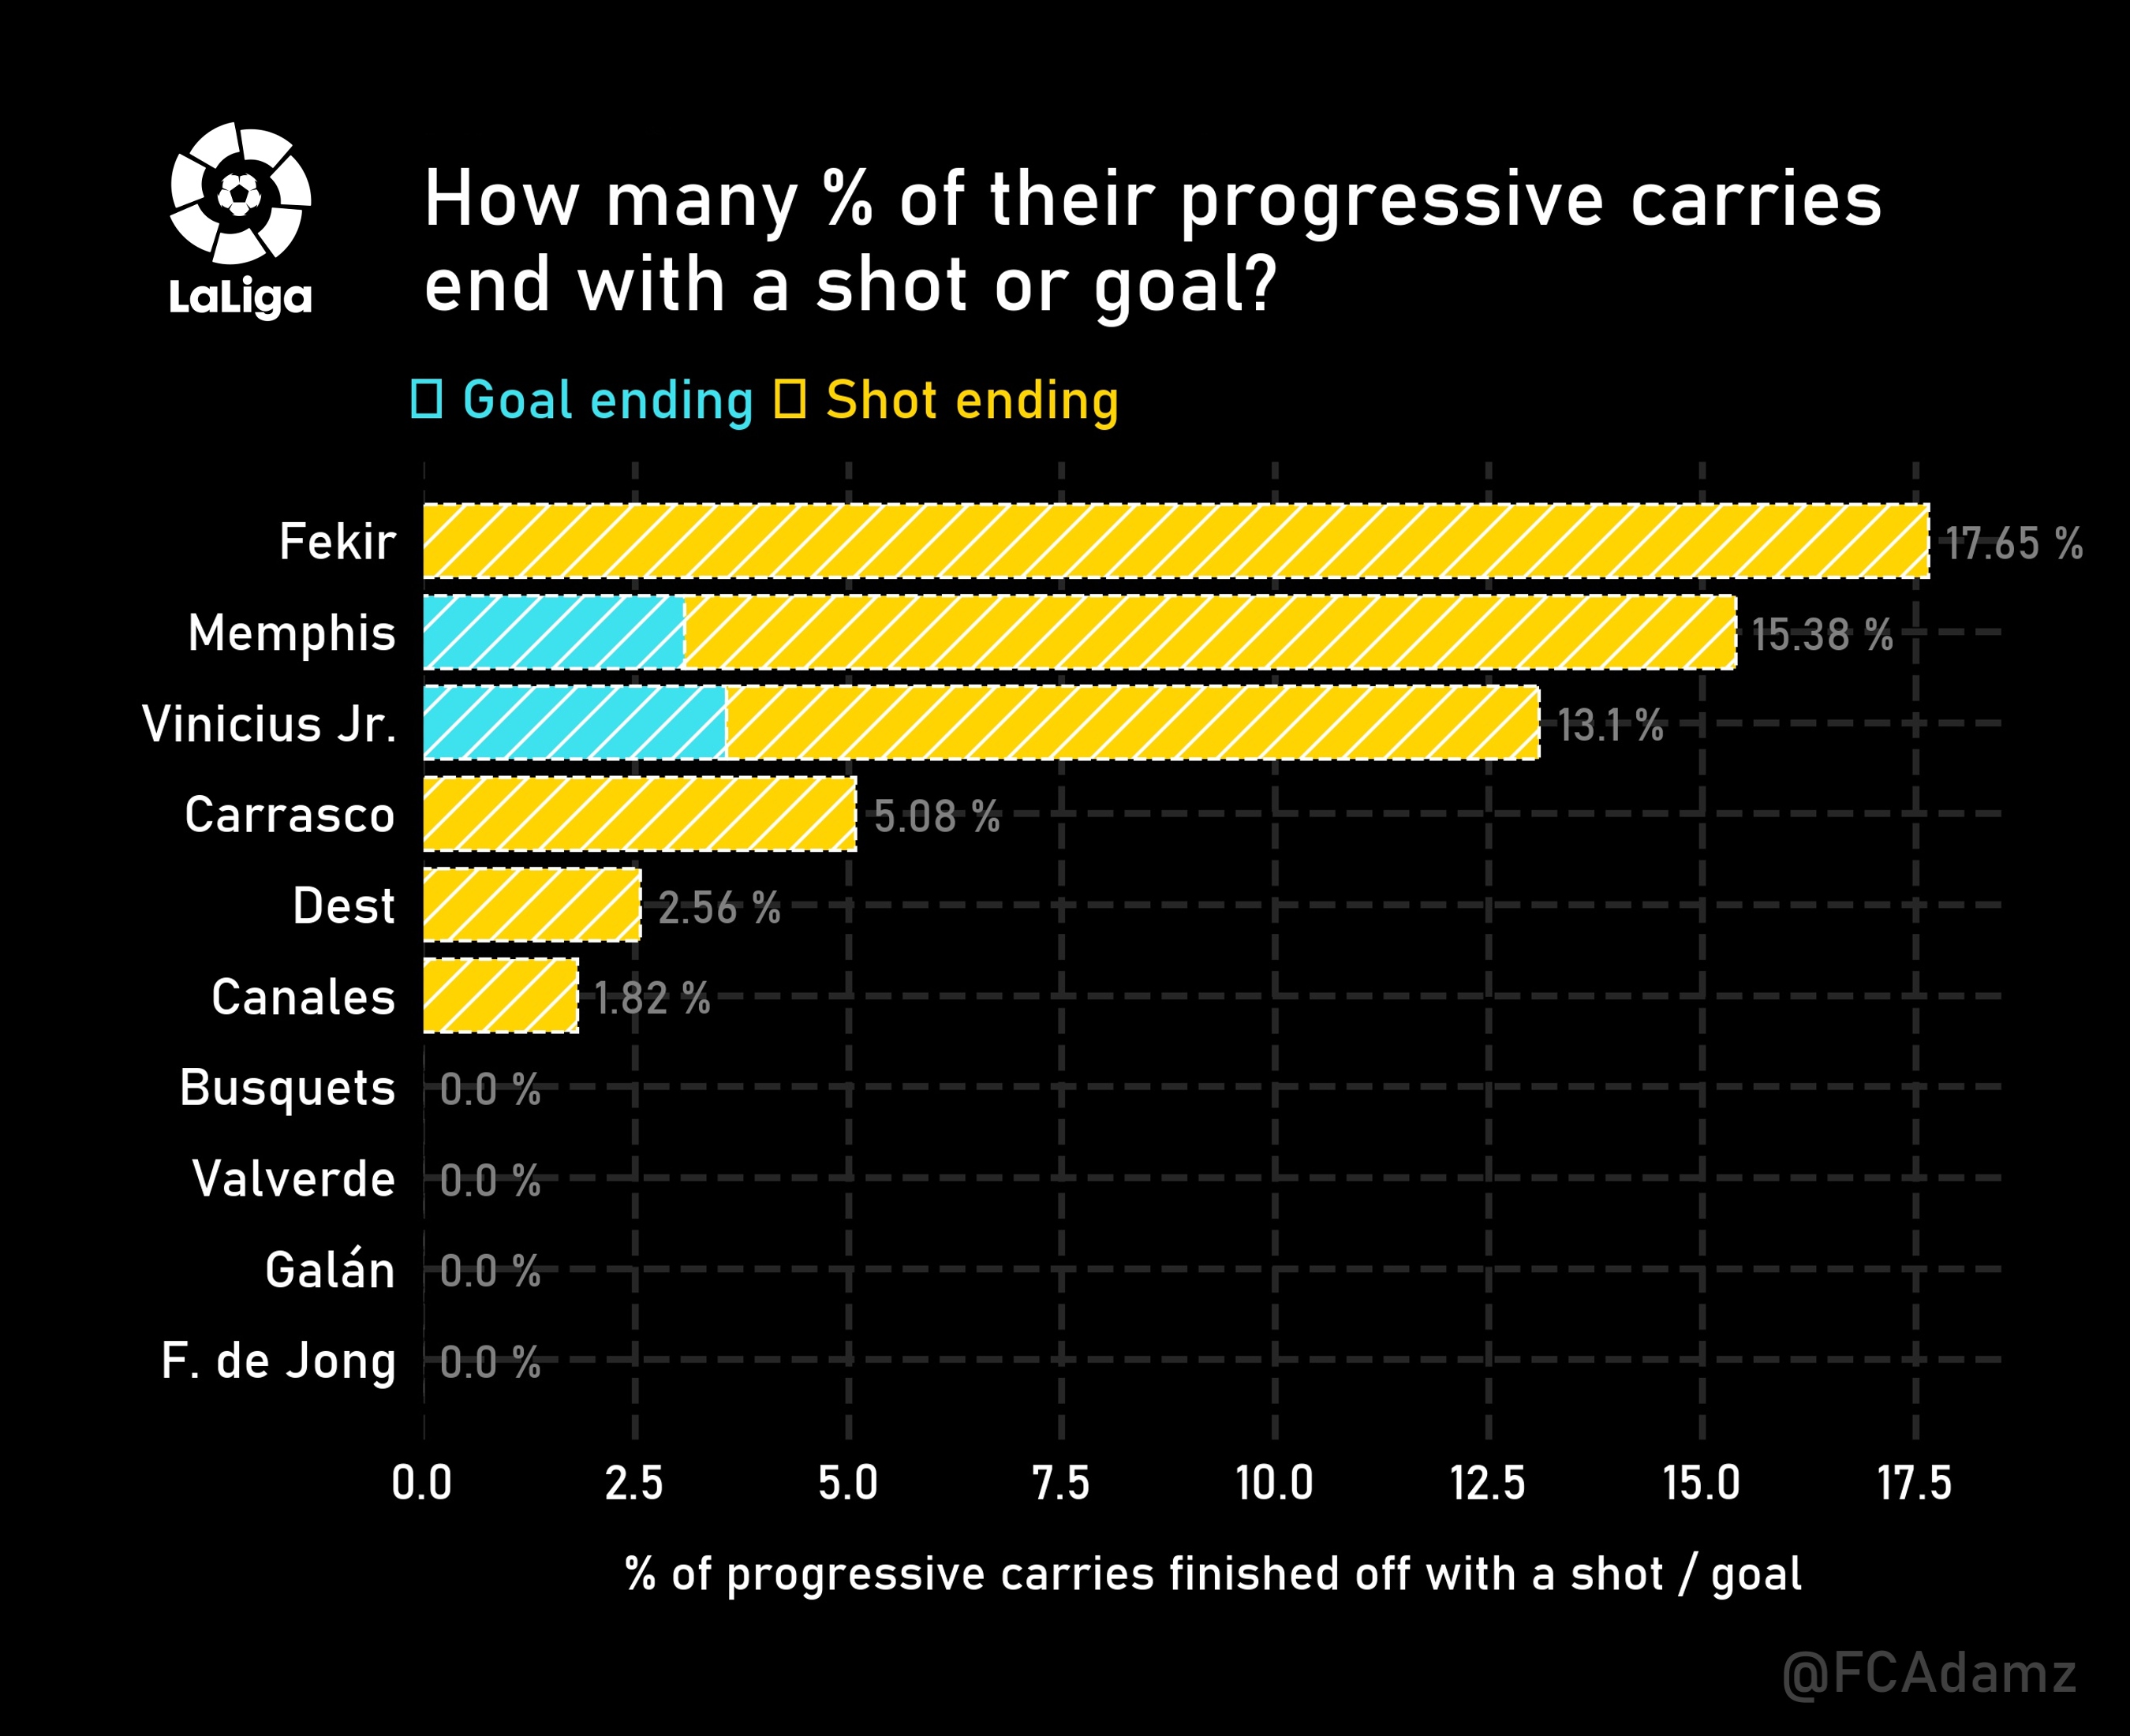
3) Which ALSO means that they actually register more Goal-creating Actions (GCA) and Shot-creating Actions (SCA) through those progressive carries into dangerous areas
FBxD_abWQAM5kba


4) Conclusion:
That's why any team that wants to actually win football games, and not just win possession %
needs players like Depay who take the risk with the logical consequence that they will fail more % compared to the 'safe option' merchants that will never win you a football game
 

Birdy

Senior Member
His link-up play is underrated, does a lot in the buildup. Has to step up in the finishing phase though.

Yep

HAve said it before, and was proven right yesterday with Ansu:
If he has quick and mobile wingers left and right, you will see a lot more assists from him and more space for himself to shoot
His hold-up play to generate Alba's cross and penalty to Ansu is an example of how he can play with his back turned
 

Home of Barca Fans

Top